Runtime traces and sessions
Last updated 7 November 2026
For teams that already send OpenTelemetry from their agents or gateways, or can switch it on. At the end you will have an ingest key, traces arriving at Spellwarden and a view of which servers, tools, skills, models and agents your agents actually use, checked against what Spellwarden has scanned.
Runtime traces need the Team or Enterprise plan, the 14-day trial included. Like every eval result, runtime evidence is informational: it does not change a score, a curation or a registry admission.
Plans: Team and Enterprise
What runtime traces give you
A scan tells you what a skill or a server contains. Runtime traces tell you what your agents really used. On the Runtime page you see the servers, tools, skills, models and agents that appeared in your traces over 1 to 90 days, with their calls, errors and latency, and each server and skill is matched to what Spellwarden already knows about it.
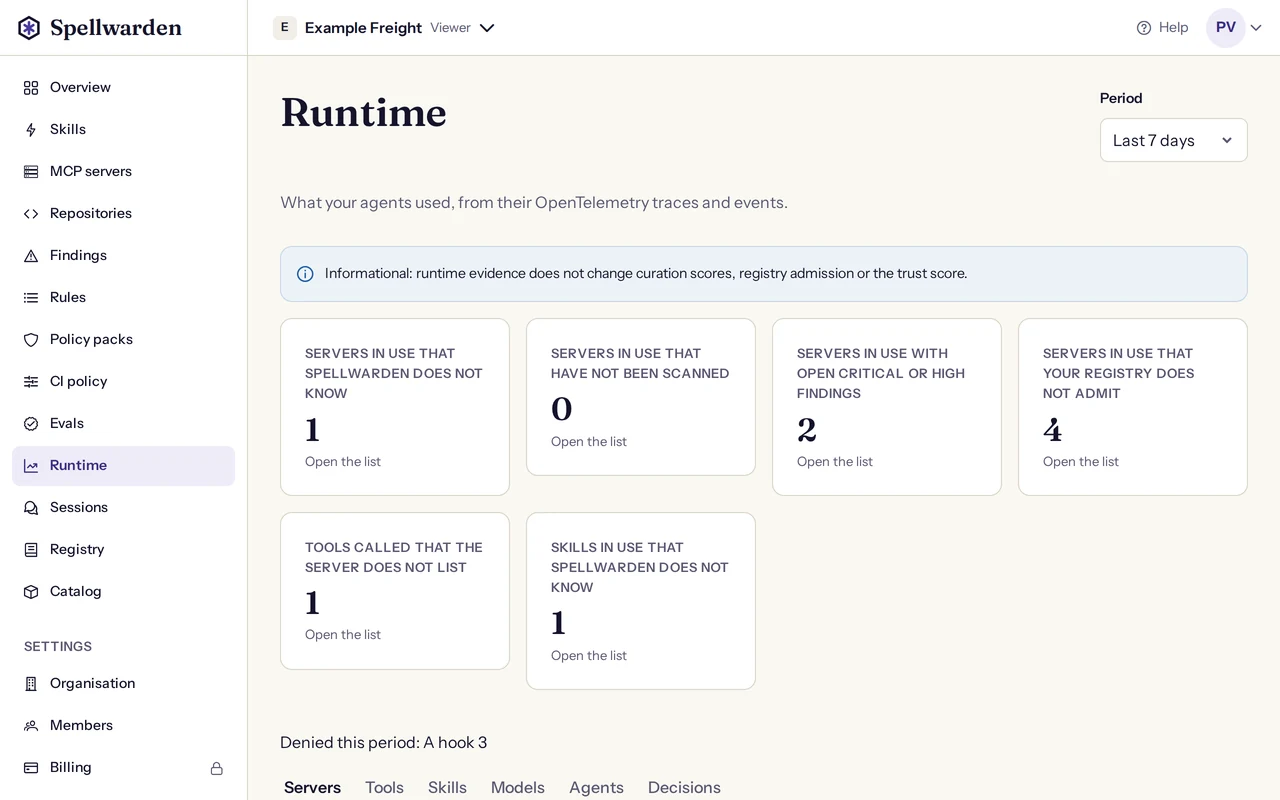
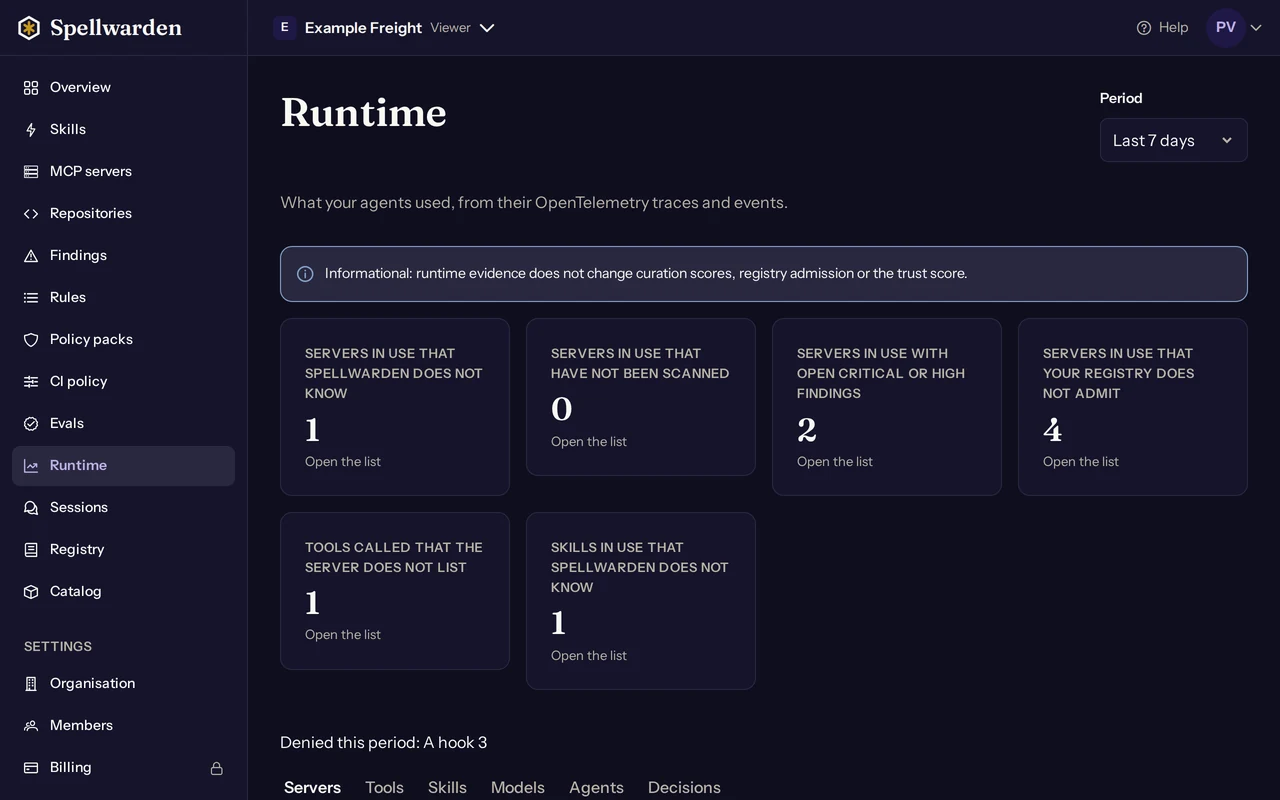
The matching turns the list into evidence. Six counts sit at the top of the page, each opening the list behind it:
- servers in use that Spellwarden does not know;
- servers in use that have not been scanned;
- servers in use with open critical or high findings;
- servers in use that your private registry does not admit (Enterprise organisations with a registry);
- tools called that the server does not list;
- skills in use that Spellwarden does not know.
Open the Runtime page in the live demo
Spellwarden accepts traces and logs over OTLP with HTTP. It does not accept metrics or gRPC. It keeps agent, model, tool, MCP, skill and decision records and Claude Code's events; a span from a producer it does not recognise is ignored.
Create an ingest key
An owner or a manager creates the key. Open Settings, Runtime traces and choose Create an ingest key, or open Settings, API keys, choose to create a key and give it the Ingest access. An organisation can have 20 active ingest keys, counted apart from its 20 read and write keys. The key is shown once, when you create it, so copy it into your secret store before you close the dialog.
An ingest key can only send telemetry. It cannot read or change anything, and the Spellwarden API and its MCP server refuse it. A key sent to the receiver that has another access is refused too. Revoke an ingest key under Settings, API keys when a pipeline is retired. More on keys in API and keys.
An organisation that is read-only, because its trial ended or its billing lapsed, cannot receive telemetry until billing is added.
Send OTLP over HTTP
Send traces to https://otel.spellwarden.ai/v1/traces and logs to https://otel.spellwarden.ai/v1/logs. Protobuf and JSON are both accepted, gzipped or not. Put the ingest key in an x-api-key header, or send it as Authorization: Bearer. Settings, Runtime traces shows the same settings with your endpoint, and each snippet below uses a placeholder where your key goes.
OpenTelemetry SDK
Set these variables where your agent runs:
OTEL_EXPORTER_OTLP_ENDPOINT=https://otel.spellwarden.ai
OTEL_EXPORTER_OTLP_PROTOCOL=http/protobuf
OTEL_EXPORTER_OTLP_HEADERS=x-api-key=<your ingest key>
OpenTelemetry Collector
Add the batch processor and the exporter to the traces and logs pipelines of your Collector. These are the settings checked against OpenTelemetry Collector Contrib 0.164.0:
# OpenTelemetry Collector Contrib 0.164.0
processors:
  batch:
    send_batch_size: 2000
    send_batch_max_size: 2000
    timeout: 5s
exporters:
  otlp_http:
    endpoint: https://otel.spellwarden.ai
    headers:
      x-api-key: "<your ingest key>"
# Add batch and otlp_http to the processors and exporters of your traces and logs pipelines.
Claude Code
Logs are required, because Claude Code reports its tool calls, permission decisions and skill activations as log events. Traces are optional and still in beta. Set the protocol, since Claude Code has no default. The same variables can go in the env block of a managed settings file.
export CLAUDE_CODE_ENABLE_TELEMETRY="1"
export OTEL_LOGS_EXPORTER="otlp"
export OTEL_EXPORTER_OTLP_PROTOCOL="http/protobuf"
export OTEL_EXPORTER_OTLP_ENDPOINT="https://otel.spellwarden.ai"
export OTEL_EXPORTER_OTLP_HEADERS="Authorization=Bearer <your ingest key>"
export OTEL_LOG_TOOL_DETAILS="1"
# Optional: traces (beta)
export CLAUDE_CODE_ENHANCED_TELEMETRY_BETA="1"
export OTEL_TRACES_EXPORTER="otlp"
Claude Code hides the names of MCP servers, tools and skills unless OTEL_LOG_TOOL_DETAILS=1 is set, and Spellwarden matches Claude Code's servers and skills by name. That variable also sends tool inputs, which Spellwarden drops unless content storage is on.
Claude Platform
Add a destination in the Claude Console with this endpoint URL and this header:
Endpoint URL: https://otel.spellwarden.ai/v1/traces
Header: x-api-key: <your ingest key>
Spellwarden takes a resent request for a duplicate only when its body is the same. The Claude Platform may batch spans differently when it retries, so a retried delivery can count its records twice.
Batch size and answers
Batch at most 2,000 records a request, or turn on gzip. The receiver refuses a body over 4 MiB as sent or 16 MiB decompressed, and a request of more than 20,000 spans and log records. Records appear on the Runtime page within a minute of being accepted.
| Answer | What it means and what to do |
|---|---|
| 200 | Accepted. With a message and a count of rejected records, some or all were not kept: the message says why, for example that every record was ignored or that a limit was reached. |
| 400 or 413 | The body could not be read, is too large or holds too many records. Lower the batch size or turn on gzip. |
| 401 | The ingest key is missing or not valid. Check the header and that the key was not revoked. |
| 403 | The key is not an ingest key, or the organisation cannot receive telemetry, for example because it is read-only. |
| 429 | The organisation sends more than 300 requests a minute, or a caller used too many keys that are not valid. The exporter retries after the wait. |
| 503 | Spellwarden is paused or busy. The exporter retries. |
Check a file offline first
Before you point an exporter at Spellwarden you can see exactly what it would keep. The scanner ships the same code that the hosted receiver runs, and its command spellwarden otel normalise reads one file, the body of an OTLP request as your exporter would send it, and prints every record Spellwarden would keep and the counts of what it would ignore. It opens no network connection and needs no key.
spellwarden otel normalise PATH --signal traces|logs [--encoding auto|protobuf|json] [--content] [--max-records N] [--max-bytes N]Install the scanner with pip install spellwarden. The signal is required for protobuf, because a traces body and a logs body look the same on the wire; for JSON it is read from the file. Add --content to also print the content that Spellwarden keeps only when an owner turns content storage on. The command exits 0, or 2 on a usage error or a body it refuses, with the reason on stderr.
spellwarden otel normalise traces.json --signal tracesThe start of its output for a file with one tool call:
{
  "stats": {
    "spans": 1,
    "log_records": 0,
    "kept": 1,
    "ignored": 0,
    "counted": 1,
    "by_dialect": {
      "genai": 1
    },
    ...
  },
  "resources": [{ "service_name": "example-agent" }],
  "records": [{ "dialect": "genai", "kind": "tool", "counted": true, "tool_name": "search", ... }]
}
Read the records first. A field that is not in the list Spellwarden keeps is not in the output either, which is the quickest way to see that user ids, email addresses, client addresses and host names never leave your machine through this check.
The inventory
Choose the period at the top of the Runtime page: 1, 7, 30 or 90 days. The tabs are Servers, Tools, Skills, Models, Agents and Decisions. Each table shows calls, errors, the error rate and latency, with the median and the 95th percentile given as a bucket such as "under 300 ms", not an exact value. The daily totals behind the page, which keep the names, addresses and sources of what was used, are stored for 400 days; the page reads up to 90 days of them.
Matching is done when you open the page, against the servers, skills and tool lists the organisation has now. A server you add after its calls were seen is matched retroactively. How a server can be matched depends on what the sender reports:
| Sender | What it reports | How it can match |
|---|---|---|
| Claude Code and the Claude Agent SDK | The server name, only with OTEL_LOG_TOOL_DETAILS=1 | By name |
| Claude Platform | The server name | By name |
| A gateway such as agentgateway | The server address and target | By host, then by name |
| A sender that reports the server's URL | The URL | By endpoint |
| MCP SDK clients | Neither a name nor an address | Not at all |
The Known to Spellwarden column says how a row matched: by endpoint, by host, by name, several servers match, name hidden, or not known. Names are not unique, so a name match says so. A matched server shows its scan status, its open critical and high findings and, for tools, whether the tool is in the server's tool list. The server's and the skill's own pages show a Seen at runtime card for the last 30 days.
The Decisions tab counts the permission decisions Claude Code reports, by who decided: a hook, the settings or a person. Spellwarden attributes a denial to its source and never to one of its own rules, because the telemetry does not name the hook. Blocks made at a gateway are not counted yet.
Sessions
Records are grouped into sessions. A session is a conversation or a run: Spellwarden groups by the conversation id or the session id the sender gave, and otherwise by trace. The Sessions page lists them newest first with the service, the agent, the time of the last record, and the number of records, errors and denials. A session whose records are all of the kinds that do not count, such as spans exported before their events, is hidden unless you choose Show all sessions.
Open the Sessions page in the live demo
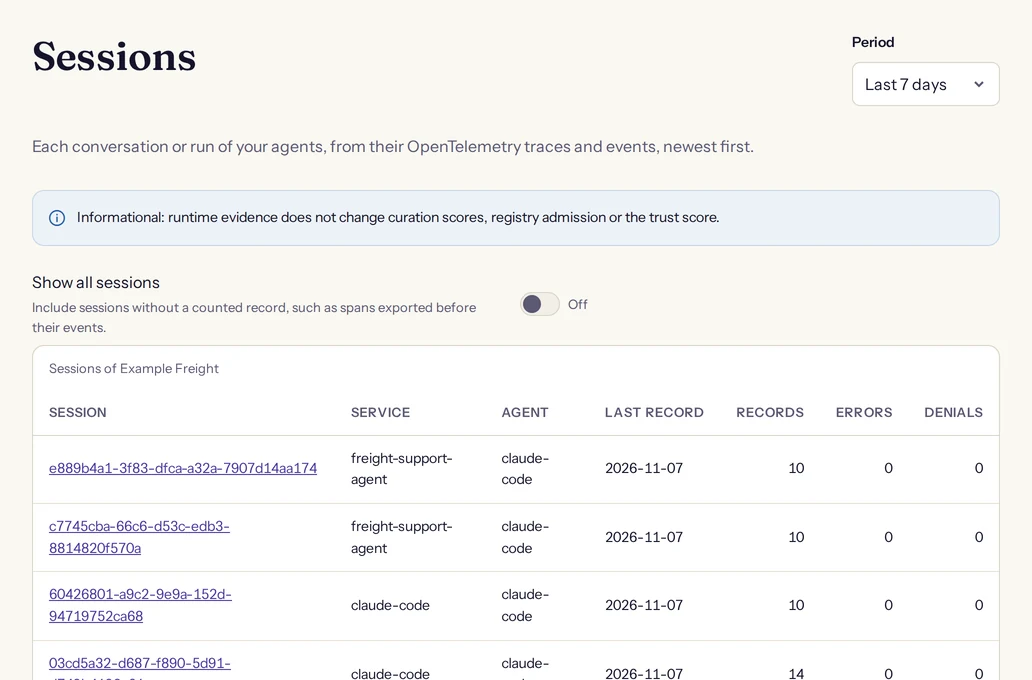
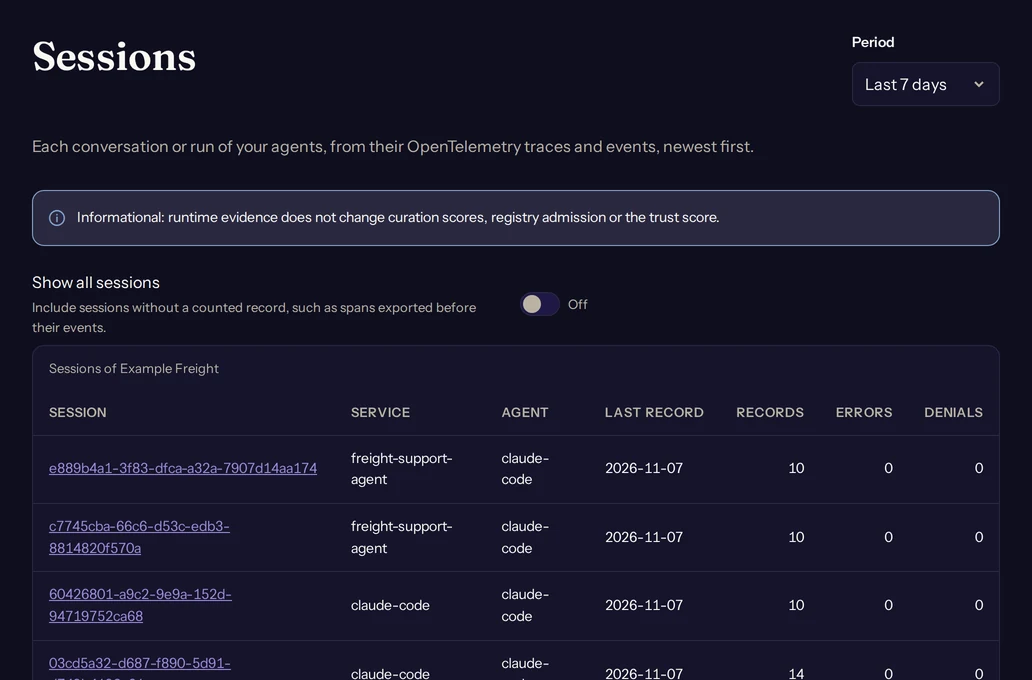
Open a session to see its steps as a tree of agent, model, tool and decision steps, grouped by trace, with errors marked and the time each step took. The page shows the newest records, at most 5,000, and says when part of a session is not shown. Session ids are kept as your tools sent them, except an id shaped like an email address, which is replaced by a hash.
Sessions are the material for session evals: once a session is finished, 30 minutes after its last record, and has stored content, it can be sampled and graded. See Session evals.
Content storage
Content storage is off by default. Prompts, answers, system instructions, tool arguments and tool results are dropped when they arrive, and only the fixed list of fields that identify a step is kept: what kind of step it was and its name, the ids that link steps, the agent, model, tool, server and skill names, timings, errors, token counts and the outcome of a decision. User ids, email addresses, account ids and client addresses are never stored.
An owner can turn content storage on for the organisation, in Settings, Runtime traces, with the switch Store prompts, answers and tool content for 30 days. While it is on:
- text shaped like a credential is masked before anything is written;
- content is kept for 30 days, and so is the session detail;
- only owners and managers can read it, in the dashboard, with Show content on a session. Members, viewers, API keys and the live demo see the metadata only;
- each time someone opens stored content, the opening is recorded in the audit log.
An owner turns it off in the same place. Stored content, and the explanations of session evals, are then deleted within 2 hours, while the records and their counts stay.
Masking recognises text shaped like a credential. It does not remove the names or email addresses that prompts and answers themselves contain, so stored content holds whatever personal data your agents handled. Turn it on when you need session evals or want to read what an agent was asked, and turn it off when you do not.
The privacy policy has the full text under Runtime telemetry.
Limits
Each plan has a monthly quota of counted records. A counted record is an agent, model, tool, MCP, skill, decision or connection record. Steps such as chains and retrievers, and stored content, do not use the quota. A cap on the telemetry received sits beside it.
| Plan | Counted records a month | Telemetry received a month |
|---|---|---|
| Trial | 200,000 | 2 GB |
| Team | 2,000,000 | 20 GB |
| Enterprise | 20,000,000 | 200 GB |
Settings, Runtime traces shows the month's use of both. When a quota is used up, Spellwarden answers every request with a success that rejects all of its records and names the limit, so exporters drop them instead of retrying, until the next month begins. Records ignored because they are of a kind Spellwarden does not keep are shown apart. To raise a limit for your organisation, write to hello.invalid [at] spellwarden [dot] ai. One organisation can send 300 requests a minute.
Private registry matching
On the Enterprise plan, an organisation with a private registry also sees whether the servers its agents used are admitted by that registry. A server in use that the registry does not admit is counted at the top of the Runtime page and marked Not admitted in the Servers list, so you can find agents that reach servers outside your approved set. Read how admission works in The private registry.